For decades, technicians would hover the back of their hands near a breaker. If it felt like a stovetop, they knew something was wrong. Today, an infrared (IR) camera turns that check into a temperature map in no time.
This illustrates the evolution from traditional “tricks” to advanced maintenance practices, highlighting the importance of Predictive Maintenance (PdM), involving accurate assessments to detect equipment issues before they escalate into significant faults.
Infrared Thermography in Predictive Maintenance solutions is a powerful Condition Monitoring technique used to detect thermal anomalies by analyzing heat emitted from equipment surfaces. As a key element of Predictive Maintenance services, it enables the detection of issues, often long before a functional failure occurs, thus reducing unplanned downtime. By delivering real-time thermal data, IR thermography complements other predictive technologies, strengthening maintenance decision-making.
This article serves as a guide to Infrared Thermography Analysis, exploring how it works, the specific tools it uses, and its integration into a Predictive Maintenance platform. Additionally, this article covers the specific types of anomalies detectable through this method, commonly monitored assets, and both the advantages and limitations of using IR Thermography. It also highlights real-world examples and practical benefits of applying this powerful technique in various industries.
Table of Contents
What Is Infrared Thermography?
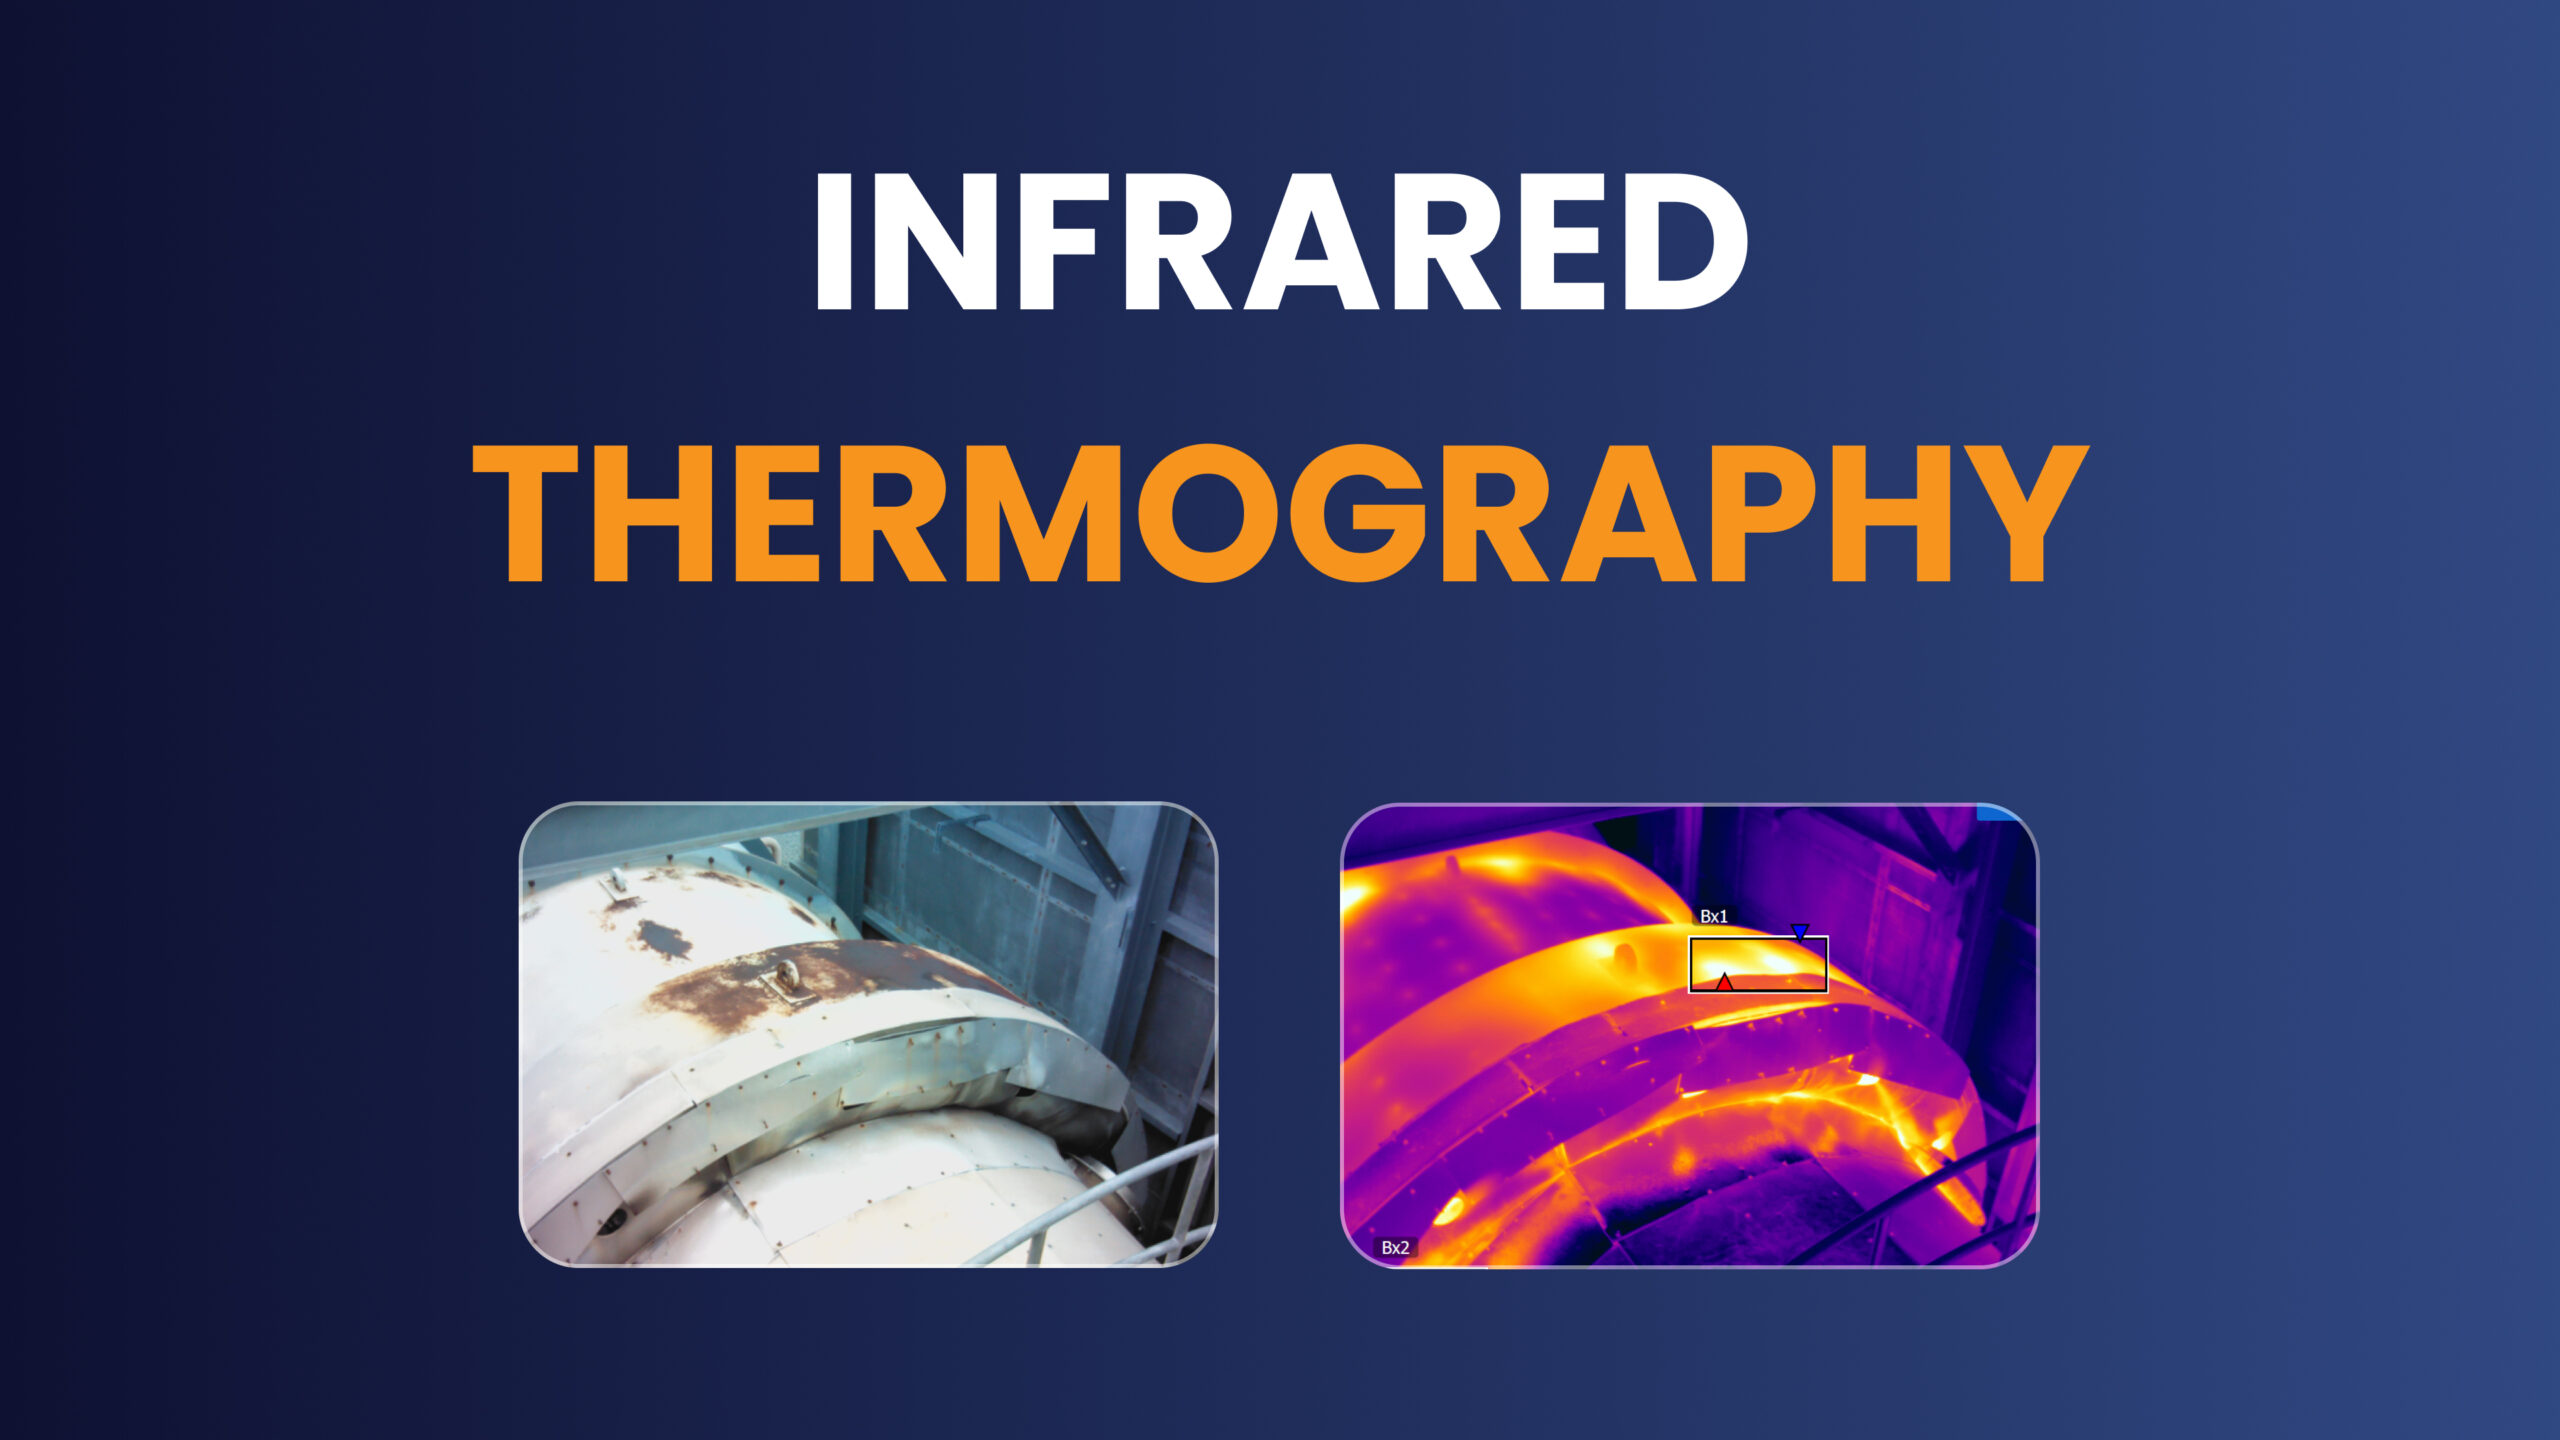
Infrared Thermography is a powerful, non-contact, non-destructive Condition Monitoring technique to detect thermal anomalies by measuring and analyzing radiometric infrared data emitted from the surfaces of machinery, electrical panels, piping, valves, etc., during operation.
This method is widely used in Predictive Maintenance, alongside other Condition Monitoring Techniques: Vibration Analysis, Oil Analysis, Ultrasound Analysis, Motion Magnification, and Motor Circuit Analysis.
All objects above absolute zero possess heat energy and emit radiation across the entire electromagnetic spectrum. Radiation in the infrared spectrum can be captured and visualized using infrared technology. However, faults such as loose electrical connections, overloaded circuits, bearing friction, degraded insulation, flow blockages, or hydrocarbon leaks create distinct heat patterns on the asset’s surface.
Within Predictive Maintenance, technicians perform infrared inspections using specialized thermal or gas-imaging cameras to capture and interpret heat variations, spotting emerging defects long before they cause energy losses, fires, environmental releases, or costly downtime.
What Does Infrared Thermography Aim to Detect?
Infrared Thermography detects a wide range of thermal anomalies that threaten operational performance and asset reliability. These are early indicators of failure, allowing earlier intervention and more effective equipment maintenance. The key benefit lies in identifying these problems through abnormal heat patterns in readings, before failure occurs.
Each failure mode generates a distinct thermal signature, often visible as hotspots, asymmetries, or plume patterns in thermograms or optical gas imaging video.
Behind every hotspot or plume is a heat-transfer phenomenon: conduction drives temperature gradients on solids, convection alters surface temperatures with fluid or air movement, and all of that shows up as radiation.
Infrared Thermography captures these radiation patterns to pinpoint where abnormal heat flow signals a developing fault.
Specifically, IR thermography can detect:
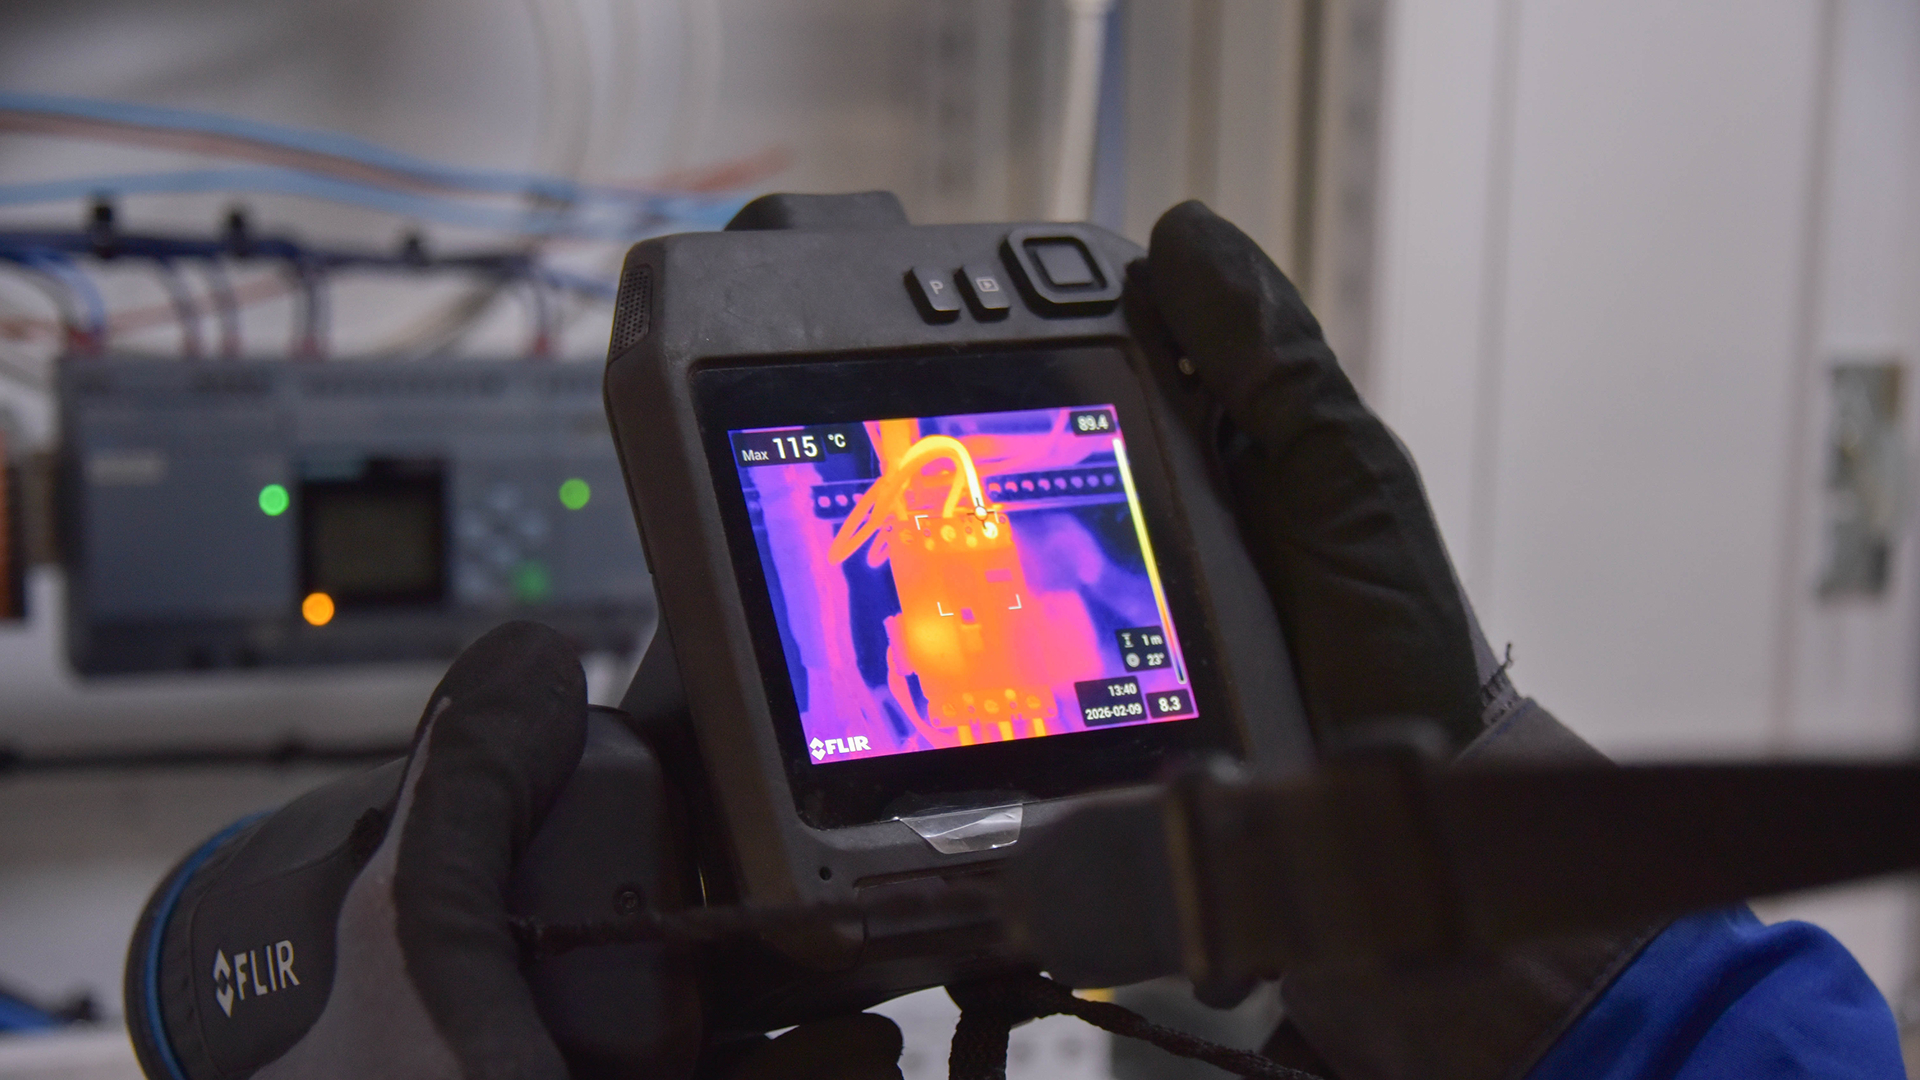
- Hotspots: Concentrated high-heat zones typically found on fuses, breakers, or electrical terminals.
- Electrical anomalies: Uneven heating or localized heat increase that occurs at loose connections, overloaded circuits, or points of phase imbalance.
- Insulation faults: Heat leakage, thermal bridging, or uneven heat distributions across insulated surfaces or components.
- Frictional heating: Elevated surface heat at bearings, gearboxes, pulleys, or brakes, common failure points in rotating equipment, and generally due to wear, misalignment, or inadequate lubrication.
- Fluid leaks: Localized hot or cold areas where escaping fluids alter surface heats, commonly detected around pipes, valves, or tanks.
- Gas leaks (OGI): Dynamic, semi-transparent plume shapes visible in infrared videos, indicating the presence of specific gases (hydrocarbons, refrigerants, or volatile organic compounds (VOC) gases) absorbing IR radiation.
Which Assets Are Typically Monitored with Infrared Thermography?
In practice, Infrared Thermography can be applied to a wide variety of assets across industrial, commercial, and infrastructure environments. Its effectiveness is particularly evident when monitoring equipment or systems where heat distribution is a reliable indicator of condition.
Even minor variations in heat patterns can reveal emerging issues, allowing maintenance teams to intervene before performance, safety, or efficiency are compromised.
Typical structural assets monitored with IR Thermography include:
- Electrical switchgear, panels, transformers, inverters, and rectifiers
- Electric motors
- Gearboxes
- Pumps
- HVAC systems
- Conveyor systems
- Piping systems
- Gas lines (for optical gas imaging)
- Heat exchangers
- Condensers and evaporators
- Industrial furnaces
- Solar photovoltaic (PV) modules, inspected from both the front (glass) side and the back (rear sheet/junction-box) side
Beyond structural equipment, Infrared Thermography is also applied directly to products in production lines to challenge production quality and process efficiency. For example, in industrial furnaces, inspections not only check the walls, insulation, and potential energy losses of the furnace itself, but also the condition of the products inside. Detecting uneven heating patterns, such as bricks that are hotter on one side due to poorly oriented burners, can reveal risks of heterogeneity in the final material and help correct process settings before quality is compromised.
How Does Infrared Thermography Work?
Infrared Thermography is a systematic process comprising the following five detailed steps:
- Deployment via handheld, drone-mounted, fixed-mounted, or robotic stations
- Data collection of emitted infrared energy (and OGI gas plumes)
- Baseline comparison of new thermograms against known-good references under matching conditions. In many inspections, it is sufficient to compare the new thermal image with a previous capture or reference baseline under similar load and environmental conditions. Even without highly precise temperature measurement, observing relative changes in surface heat distribution is often enough to identify an emerging issue.
- Data transformation of radiometric readings (apparent temperatures) into emissivity- and environment-corrected temperatures. When a deeper analysis is required, such as calculating energy losses or quantifying severity, the raw infrared readings must be corrected for emissivity, reflected temperature, and environmental factors. These corrections bring the apparent temperatures closer to the true values, ensuring that any diagnostic or energy-efficiency calculation is as accurate as possible.
- Fault-signature mapping by matching thermal anomalies to a fault library for classification and prioritization
Step 1: Deployment Modes
Infrared Thermography can be deployed in three practical modes using an infrared camera: handheld, drone-mounted, or fixed-mounted. From a broader perspective, handheld and drone-mounted solutions are both considered mobile approaches, while fixed-mounted systems provide continuous monitoring.
The choice between mobile and fixed deployment is not directly tied to the criticality of the equipment, but rather to whether continuous monitoring is required. Mobile inspections (handheld or drone) provide flexibility and coverage for campaigns, while fixed systems ensure uninterrupted monitoring where safety, risk, or process-criticality demand it.
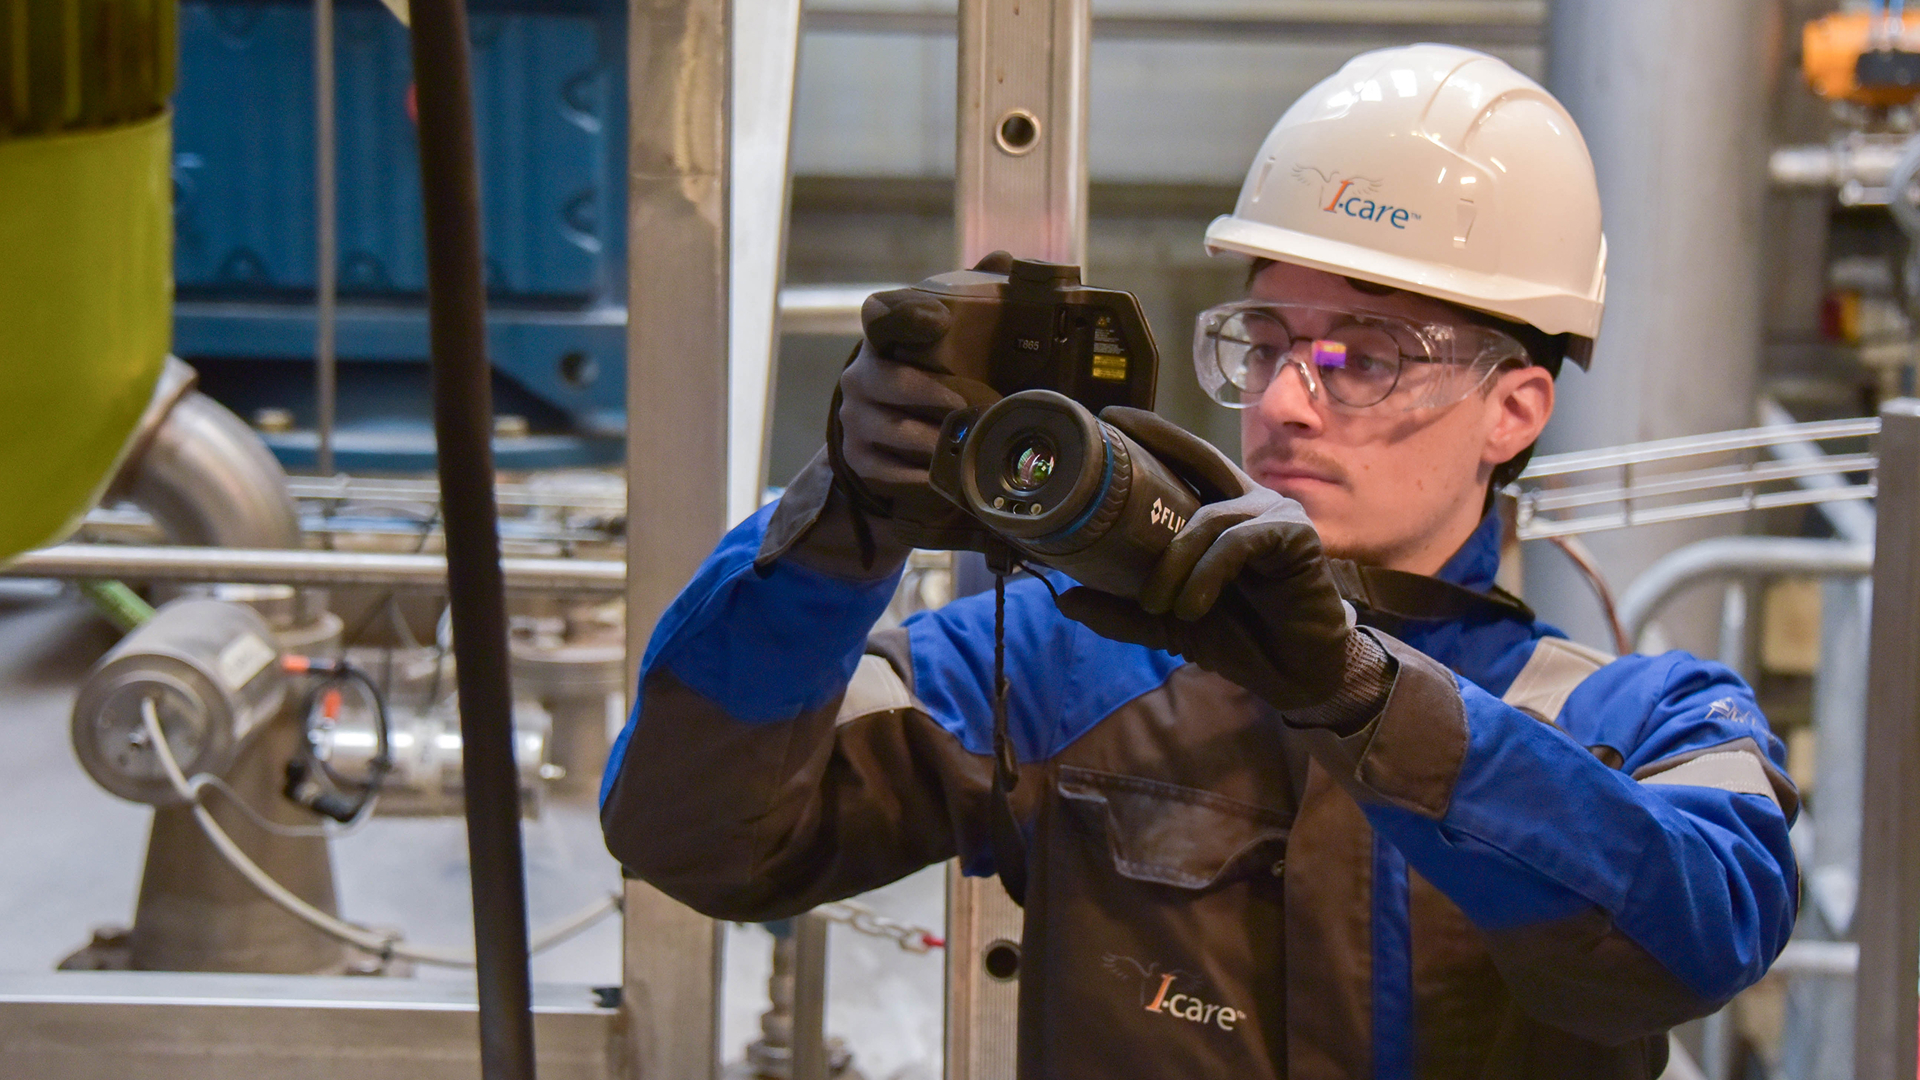
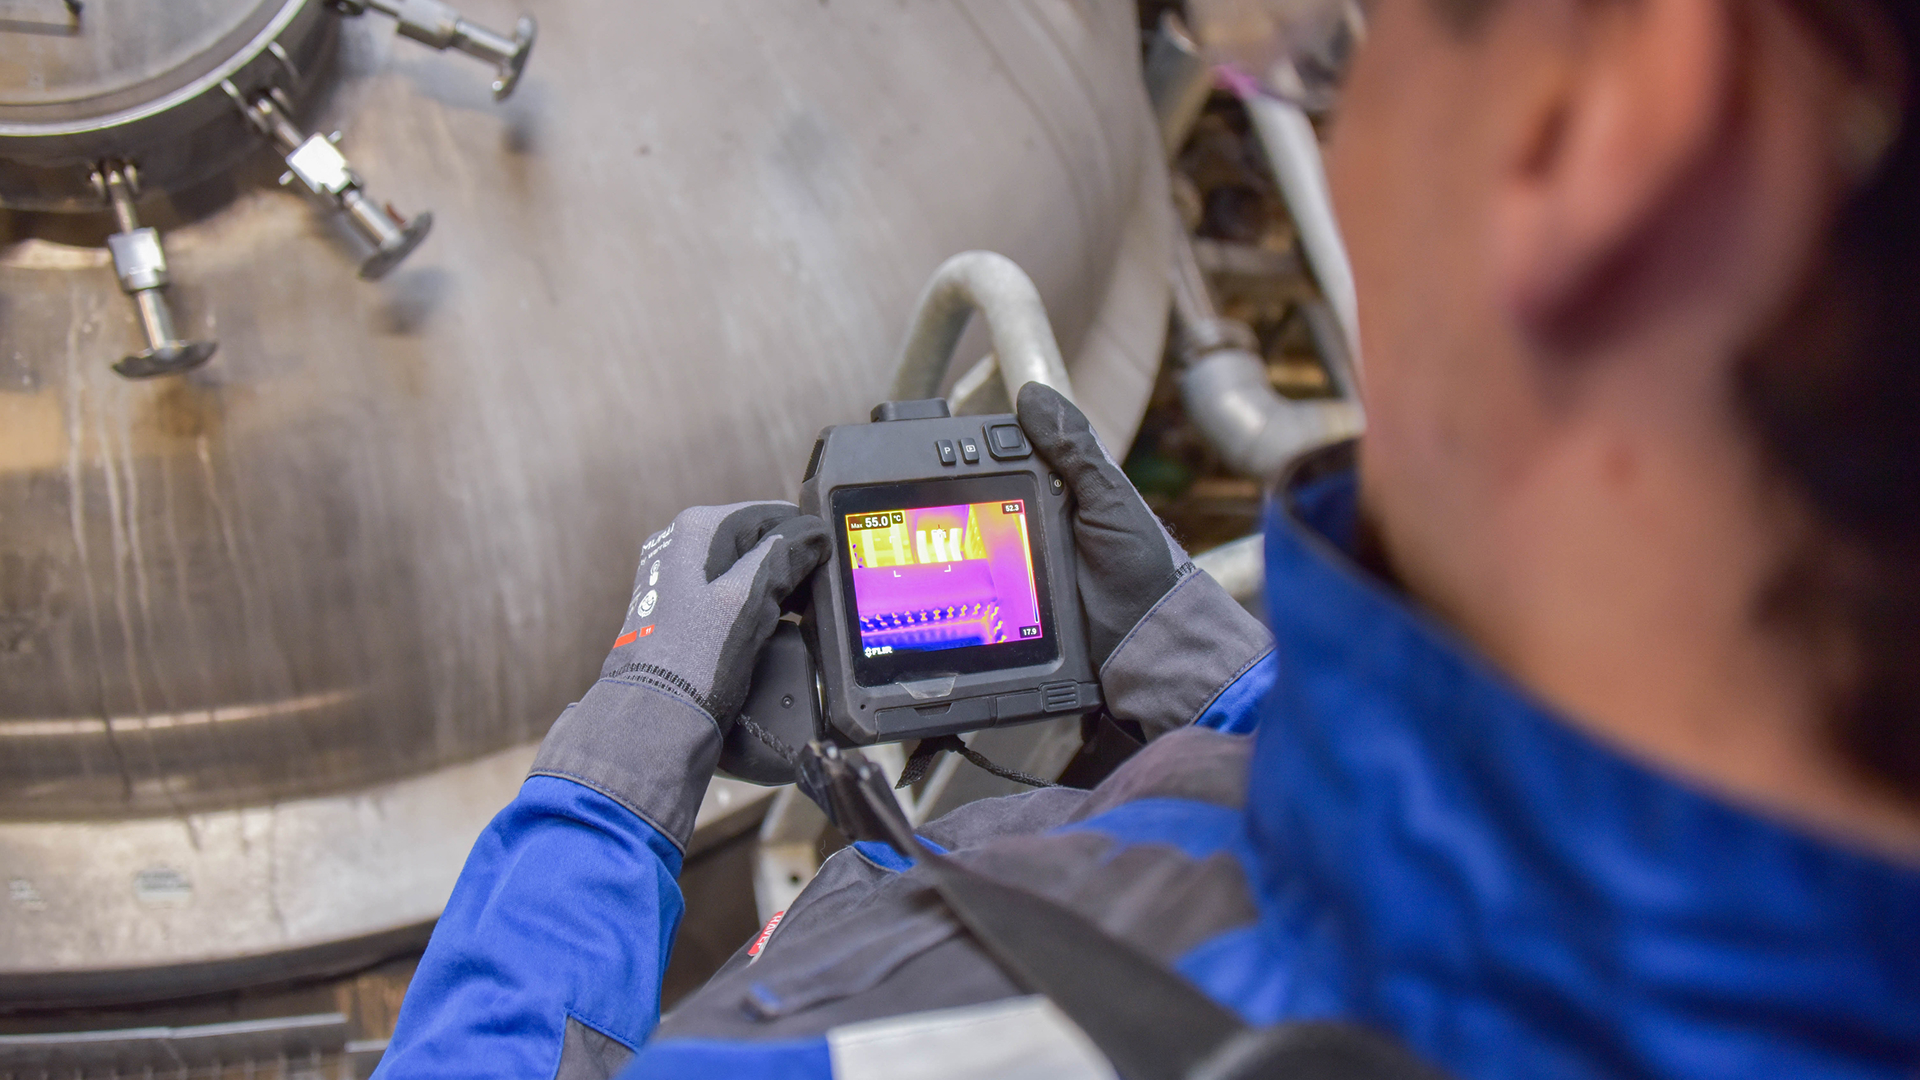
- Handheld mode: It is the most flexible and widely used deployment mode, powering both route-based inspection and on-the-fly diagnostic checks. Technicians use compact, portable Infrared cameras to perform spot-by-spot thermal checks on assets during predefined inspection rounds.
Operators can interpret anomalies in real time via the built-in display, and instantly capture thermal images or video for documentation. Handheld IR cameras may also be operated remotely (USB, Wi-Fi, or Bluetooth) in high-risk environments where direct access is unsafe. Thanks to their mobility and ease of use, handheld IR cameras are a key tool in predictive maintenance workflows. - Drone-mounted mode: It offers an aerial inspection solution for remote, elevated, or hard-to-access infrastructure. In this mode, Infrared cameras are attached to Unmanned Aerial Vehicles (UAVs), enabling technicians to perform broad-area thermal scans of assets such as pipelines, solar farms, electrical substations, or rooftops, without scaffolding or direct operator access.
Drone-mounted inspections are typically deployed on demand, providing quick, comprehensive coverage while significantly improving inspection efficiency and safety for maintenance staff. As an extension of mobile inspections, they are especially valuable when large-scale or inaccessible assets must be covered systematically. - Fixed-mounted mode: It is the only deployment mode that delivers truly continuous, always-on thermal insight without reliance on inspection schedules. Infrared cameras are permanently installed at strategic locations to provide real-time thermal monitoring of specific equipment, processes, or environments.
These IR cameras enable automated thermal alerts, gas-leak detection (with OGI-capable systems), and long-term trend analysis. They are typically applied where components require 24/7 surveillance (for example, monitoring a molten bath in a production line) or where there is a high risk of fire or explosion (for example, waste storage facilities). In contrast, in environments such as electrical substations or control rooms, portable cameras are generally preferred during periodic inspection campaigns, since each item of equipment must be analyzed individually. In practice, a mobile inspection is often performed first to determine the most suitable hardware, measurement ranges, and resolution before installing a fixed system.
Step 2: Data Collection
Infrared thermography captures infrared radiation emitted by surfaces (heat energy) and converts it into a heat map, or thermal cartography.
This process relies on sensors called microbolometers (cooled or uncooled), which transform the incoming infrared radiation into electrical impulses that are displayed as apparent surface temperatures. At this stage, the values shown correspond to apparent temperatures only, which usually differ from the object’s true temperature.
The camera is positioned to face the asset or area of interest, ensuring a clear line of sight, proper distance, and correct focus.
Gas leaks can also be visualized using Optical Gas Imaging (OGI). This specialized form of IR thermography uses cameras equipped with narrow-band spectral filters tuned to detect gases.
Step 3: Data Transformation
Proper setup is essential to ensure reliable thermographic inspection results, especially when identifying subtle temperature variations.
Raw infrared data is converted into a temperature measurement based on the intensity of emitted infrared radiation and adjusted according to emissivity and environmental factors.
Typically, once the correct parameters related to the inspected assets are encoded, this conversion occurs directly within the camera for immediate diagnostics and field analysis, allowing operators to view real-time temperature readings and thermograms.
In more advanced applications, raw radiometric data can be exported and processed later using specialized software, enabling fine-tuning of emissivity, reflected temperature, and environmental corrections for greater diagnostic efficiency. It is also useful when higher accuracy or post-inspection analysis is required.
The recorded thermograms are then analyzed to detect the presence of thermal gradients and to determine the origin of the heat, helping to establish the root cause of the anomaly. Depending on the type of equipment analyzed, its operating conditions, the load it is subjected to, and the temperature variations observed, the thermographer will determine the severity of the anomaly.
In OGI workflows, spectral filtering isolates the target gas’s absorption bands, producing overlays or thermal video frames that highlight gas leaks and movement.
Step 4: Baseline Comparison
Thermal anomalies can often be identified directly by the operator during inspection, through visual cues such as unexpected hot spots, asymmetries, or gas plumes.
In the first approach, each new thermogram or gas-leak capture is compared against a stored baseline representing the asset’s normal thermal behavior. This method, known as qualitative thermography, relies on simple image-to-image comparison and allows technicians with limited expertise to spot possible anomalies without measuring temperatures.
Baselines may come from manufacturer specifications, industry norms, or design expectations, but the most reliable practice is to establish in-situ baselines under known-good conditions, such as immediately after commissioning or maintenance. These references form a database that enables future inspections to be compared consistently against a known-good state.
When deeper analysis is required, thermographers apply quantitative thermography, working with corrected temperature values and detailed equipment data (design characteristics, admissible loads, standards, manufacturer limits). This enables them to determine root causes, quantify reliability risks, and recommend proactive actions.
Effective comparison requires matching the same operating state, load conditions, ambient temperature, and viewing geometry (angle, distance, and orientation).
Deviations from the baseline, often visible as temperature differences, may indicate potential issues.
Step 5: Fault-Signature Mapping
Once infrared data is processed and visualized, thermal anomalies or optical gas imaging are interpreted against known failure modes.
In Infrared Thermography, common fault signatures include:
- Localized hot spot on an electrical connection, which could have as possible causes an incorrect connection, inadequate or thermally/mechanically deteriorated crimping, or a defective internal contact
- Excessive heating at a bearing or shaft end, which could have as possible causes friction from misalignment or inadequate lubrication
- Asymmetrical heat distribution across motor phases, which could have as possible causes unbalanced phase loading. However, current measurements are required to confirm this, and if currents are balanced, other issues, such as internal defects or corrosion, should be considered
- Thermal bridging across insulation layers, which could have as possible causes insulation degradation or damage, or simply normal conduction through fixing elements such as brackets on hot piping
- Cold spot in a heated pipeline or process line, which could have as possible causes a flow blockage or a poor heat transfer
- Visible gas plume in OGI video, which could have as possible causes leakage of hydrocarbon, refrigerant, or VOC gases
- Hot zone on an insulated steam pipe, which could have as a possible cause a condensation effect that, over time, may result in pipe corrosion
Trained thermographers interpret these patterns using a combination of reference libraries, operating context, and equipment knowledge to accurately classify the anomaly and determine the root cause.
What Tools Are Used in Infrared Thermography?
Infrared Thermography relies on two categories of tools: hardware that captures thermal or gas-imaging data, and software that processes, corrects, and interprets it.
Hardware Tools
- Handheld Infrared Cameras: Portable thermal imagers used for route-based inspections to capture radiometric images and real-time temperature readings. They offer flexible, on-the-go diagnostics, come in various resolutions depending on the inspection detail required, and often include connectivity features for safe remote operation and quick data upload to PdM platforms.
- Fixed or Mounted Infrared Cameras: Permanently installed systems that provide continuous, 24/7 thermal monitoring of critical equipment or high-risk areas. Hard-wired for power and data, they integrate with PLC/SCADA and PdM platforms to deliver real-time alerts, automated trend analysis, and centralized reporting.
- Automated IR Inspection Stations: Robotic or fixed systems that combine thermal imaging with automated motion to perform repeatable and high-frequency inspections. They improve inspection consistency, throughput, and early anomaly detection, and integrate with PLC/SCADA and PdM platforms to trigger inspections automatically, log radiometric data, and generate real-time alerts and trend reports.
- Drone-mounted IR Cameras: UAV-based thermal imaging systems used to inspect large, elevated, or hard-to-access assets. They enable systematic, automated flight routes, capture thermal video during flight, and upload radiometric images and flight logs to PdM platforms for near-real-time analysis, trending, and alerting.
Software Tools
- Thermal Analysis Software: Tools used to process and interpret radiometric data after inspection. They allow emissivity adjustments, environmental corrections, and historical comparisons, and generate standardized reports and temperature trends that support accurate diagnostics and maintenance decisions.
How Does Infrared Thermography Integrate with a Predictive Maintenance Platform?
Infrared Thermography data, whether streamed live from fixed cameras or batch-uploaded from handheld and drone units, feeds into the PdM platform (e.g., I-see software).
Once uploaded to the PdM platform, normalized radiometric images are tagged with asset metadata, and the platform then:
- Charts temperature trends against historical baselines to spot gradual degradation.
- Runs anomaly-detection rules or machine learning models to flag sudden deviations.
- Triggers alerts when specific temperature thresholds are exceeded.
- Generates work orders in CMMS (Computerized Maintenance Management System) or EAM (Enterprise Asset Management) systems for prioritized follow-up.
What Are the Advantages of Infrared Thermography?
By revealing otherwise undetectable thermal and gas anomalies instantly and safely, infrared thermography stands apart with five key advantages.
The first and most important advantage is that it allows monitoring of equipment under normal operating conditions. Inspections can be performed without interrupting production, without direct contact with the equipment, and while minimizing risks to the personnel carrying them out.
Another advantage is the ability to visualize temperature gradients and thermal anomalies that cannot be seen by the naked eye or detected by many other diagnostic technologies. This detailed thermal insight allows maintenance teams to pinpoint early-stage faults before they develop into costly failures.
A further strength of Infrared Thermography is its ability to scan large asset groups or broad physical areas in a short period of time. This makes it especially valuable in manufacturing plants, production facilities, or other industrial sites with extensive equipment layouts, where traditional inspection methods would be slow and resource-intensive.
The technology also makes it possible to detect gas leaks optically, including hydrocarbons and refrigerant gases, without the need for chemical sensors or sniffers. This contactless approach not only improves safety by reducing operator exposure but also streamlines leak detection in complex or hazardous environments.
Finally, Infrared Thermography supports safe, remote inspections of energized high-voltage systems. Maintenance teams can assess the condition of electrical infrastructure without direct contact, eliminating the need for system shutdowns and reducing the risk to personnel while ensuring that critical equipment remains operational.
Ready to Turn Invisible Anomalies into Actionable Insights?
Hotspots, degraded insulation, overheating bearings, or leaking systems often go unnoticed until they trigger costly failures.
With I-care’s infrared thermography inspections, these anomalies are uncovered early, keeping your plant safe, reliable, and cost-efficient.
What Are the Limitations of Infrared Thermography?
While powerful, Infrared Thermography has practical boundaries that determine whether it can be applied in a quantitative way (with reliable temperature values) or only in a qualitative way (based on apparent temperature patterns):
- Limit analysis of mechanical equipment to external surfaces, since infrared thermography only reveals heat that manifests at the outside. It can localize zones to be prioritized for further investigation, but requires complementary techniques, such as vibration analysis for mechanical faults or motor current analysis for electrical ones, to identify internal defects.
- Provide limited early-stage warning for slowly developing mechanical issues that don’t generate noticeable heat.
- Require surface preparation or precise emissivity adjustments only for quantitative measurements on reflective or insulated materials. For qualitative inspections, where the focus is on heat distribution rather than exact values, no preparation or emissivity setting is necessary.
- Face challenges in mechanical applications due to emissivity variability (e.g., corrosion, dirt, oxidation), environmental interferences (wind, humidity, reflections), and complex geometries, often necessitating complementary techniques such as ultrasonic testing, especially when assessing operational risk in critical systems.
Real-World Example of Usage
At a solar photovoltaic (PV) farm, handheld infrared cameras were used to inspect the rear side of PV modules, focusing on junction boxes and rear sheets. Thermograms revealed a localized hotspot at one junction box, significantly hotter than the surrounding modules.
The images were uploaded to the PdM platform, where automated analysis compared the thermal profile against baseline conditions and triggered an alert. The anomaly was traced to a defective connection inside the junction box, which, if left unaddressed, could have led to accelerated degradation of the module and a reduction in overall energy yield.
Maintenance crews were able to schedule a targeted replacement of the faulty module during a planned service window. The early detection preserved system efficiency, reduced the risk of further electrical damage, and avoided costly downtime across the installation.
Necessary Skills and Training
Infrared Thermography requires a skill set that spans from basic image capture to advanced thermal diagnostics, depending on the practitioner’s role and depth of involvement.
Skills Needed
Infrared Thermography requires a basic to intermediate level of expertise, depending on the scope and complexity of the inspections conducted. To perform standard inspections, technicians need a foundational understanding of infrared technology, including core theory, particularly key concepts such as emissivity, reflected temperature, and heat transfer.
They must also be able to adjust camera settings like focus, emissivity, color palette, and temperature span, and capture thermograms from appropriate angles and distances. While introductory training covers the core thermography techniques, reliable inspections also demand in-depth knowledge of each asset’s design, materials, and operating conditions. Only with that system context can technicians distinguish normal thermal patterns from true anomalies.
Beyond standard inspections, advanced diagnostics require deeper interpretation and contextual awareness. Interpreting thermographic data at this level demands a higher degree of expertise, including the ability to contextualize findings, distinguish genuine faults from false positives (such as reflections or environmental influences), and recognize thermal patterns linked to specific failure modes. Skilled practitioners also evaluate more nuanced indicators, such as thermal bridging, uneven load distribution, or gas plume dynamics in Optical Gas Imaging (OGI) workflows. This level of analysis typically requires formal training and certification, such as ISO 18436-7 Category I, II or III Thermographer credentials and a solid mastering of the equipment presented for inspection.
Training
Is your team struggling to leverage infrared insights or meet ISO 18436-7 certification requirements?
Technical Associate of Europe’s thermography trainings, from hands-on introductory workshops to advanced multi-day courses, are designed to bridge that skills gap and get your staff certified.